The Looming Recession and What to do About it.

Australia’s economy has been the envy of the world, not having had a recession in over 30 years. The only notable exception being the transitory contractional blip in 2020 which passed us by without fuss in the throw of the pandemic. This privileged track record has left many commentators calling it “the miracle economy.” Which, it really is. Strong labour markets, declining interest rates and the resource boom of the 2000’s has allowed us to be the benefactors of a very prosperous nation indeed. However, such sustained prosperity comes with its perils. One such hazard being the tendency for us to forget. Periods of booms are inevitably followed by periods of bust, usually only regularly enough for the last slow down to have passed from memory. These corrections that bring our irrational exuberance back down to earth are the equivalent of the police shutting the music off at a street party that has got out of hand. It’s no fun but might be for our own good.
Periods of expansion and contraction in economies should be thought of as a normal part of the economic cycle and both phases serve a function. When economies slow, it’s the macro machine telling us that things have overheated. Usually, these periods are characterized by a significant decline in economic activity, reduced income, increased unemployment, and a general reduction in productivity. Obviously, this isn’t fun. However, it also curbs inflation and corrects asset prices that have inflated to unsatiable levels. Business and industries that are inefficient fail which allows for resources to be directed towards more productive uses. In our world of four-year election cycles, governments have the perverse incentive to defer times of contraction until after they have left office. They do this through monetary and fiscal policy that can be the right thing if done prudently. Though, usually intervention is overdone, mollycoddling the economy by increasing debt, which only defers the hangover and mounts its severity.
There are storm clouds on the horizon that indicate we could be in for one of these periods. Inflation has been in the headlines and has been talked about to death over recent months. Less discussed is the yield curve. A yield curve is a graphical representation of the interest rates on bonds with a range of maturities. It shows the yields of bonds with short-term maturities to yields on bonds with long-term maturities. Usually, it slopes upward, reflecting the fact that investors typically demand higher rates of return for taking on the additional risk of lending money over a longer period. Normally, it should look like this:

However, currently yield curves are “inverted” meaning that the short-term yields are greater than long-term ones. Currently, in Australia they look like this:

And in the US the yield curve looks like this:

This is a strong indicator that we might be in for a hard landing. The inverted curve is the markets’ view that recession is looming, and has proven to be remarkably accurate. Over the past 60 years, the inverted yield curve has been a precursor to a recession in the US every time with only one false-positive in the mid-1960’s. It is the difference between long duration bonds and short duration bonds that provides the most insight. In the below chart we look at the spread between 10 year US treasuries and 2 year US treasuries by subtracting the 10 year yields with the 2 year yields.

The grey bars indicating the times of recession show that markets being forward looking are highly efficient at pricing securities. Each time the blue line fell below zero, the economy experienced a recession 6 months to 18 months later. We can see that bond markets were able to predict the following:
1. January 1980 to July 1980: A short lived recession triggered by an energy crisis (Iranian revolution) and efforts by the Fed to tame inflation
2. July 1981 to November 1982: referred to as the “double dip” recession, this period was marked by high interest rates, inflation and unemployment
3. July 1990 to March 1991: This eight month recession was caused by a combination of factors including the Gulf War, restrictive monetary policy, and sharp declines in consumer/business confidence
4. March 2001 to November 2001: The bursting of the dot-com bubble, coupled with the economic impacts of September 11
5. December 2007 to June 2009: The GFC, the greatest recession the world had seen since the Great Depression caused by a crisis in over lending and sub-prime mortgages.
Currently the yield curve is inverted to such an extent that we haven’t seen since the 1980’s. Economies and share markets are related but are not the same. What’s interesting is when we juxtapose the above chart with the one below that shows how share markets have behaved in the wake of these yield inversions:

While we can observe some disparity in the severity of share market response, we can say with reasonable confidence that yield inversion should not come as welcomed news to investors.
The question remains, “what should investors do about this?” Naturally the answer is – it depends. Like all things in investing, how you should respond is going to be unique to you. It is in times like this that good, non-conflicted advice is going to pay the most dividends. Investors without a clear strategy, robust asset allocation and risk framework will be caught out. Warren Buffets famous adage rings true “it’s only when the tide goes out that you see who has been swimming naked.”
Younger accumulators should be taking this as an opportunity to test their resolve. Fair weather investors and those who hope to pre-emptively predict market movements are the ones that stand to lose the most. Timing markets is a mugs game. Instead, younger investors should be focused on building resilience in their portfolios and protecting their greatest asset which is their human capital. The best hedge younger investors have is the ability to continue to derive an income, which will ensure that they are not forced to redeem holdings in their portfolio if markets were to contract. Even better, would be for accumulators to continue to direct surplus cash towards their portfolios, particularly during times when markets have fallen out of favour. Investing in every season, with no effort to pick winning stocks or time markets has proven to be the best strategy.
Many studies have demonstrated this, one such being research conducted by Fidelity Investments. In our charts we see that 1980 was one of the most pessimistic times to be invested. However, Fidelity Investments studies found that those who decided to invest in the S&P 500 at this time would have been rewarded with an annualized return of 8.8% by 2018. A $100,000 portfolio invested at the peak of pessimism would have grown to be $2,465,460 by 2018. Should this investor have attempted to time markets and only missed the five best trading days during this time period, their return would have diminished to 7% reducing their portfolio to $1,307,927. If this investor had missed the 30 best days, their return would have reduced to just 3.6% decreasing their portfolio to $383,416. Lastly, should they have missed the 50 best days, then they would have reduced their return to 1.2% and for all their efforts, would only have $157,347 at the end of this period.

Let’s review for a moment the alternative actively managed philosophy that contends that you can time markets. Being charitable, lets leave aside the reality of transaction costs and tax. What are the chances that investors who take this approach can accurately predict the worst days? There are 253 trading days in a year. This means that there were 9,614 trading days over the period of Fidelity's study. Avoiding the worst trading day over this period is a 0.01% chance. Accurately avoiding the five worst trading days is a 0.002% chance. Talk about finding a needle in a haystack. In other words, you have a 99.998% chance of being in a better position if you simply adopted a buy and hold approach to investing than trying to predict the five worst trading days. I’ll take those odds any day.
For pensioners and retirees who are relying on their investments to provide income, the answer isn’t as clear cut. People are living longer and retiring sooner, meaning that capital longevity presents a tricky problem for those who are relying on their portfolio to support a comfortable retirement. The jury is still out on best practice when it comes to managing investment drawdowns. This is particularly true in the initial years of retirement due to what’s called “sequencing risk.” Sequencing refers to the risk that the order in which investment returns occur can impact the value of an investment portfolio, especially if withdrawals are being made from that portfolio. This risk is normally associated with the phase either right before or after the start of retirement.

Consider an individual who has just retired and is beginning to draw down their investment portfolio for living expenses. If the market performs poorly in the early years of their retirement, they would need to sell more of their investment to meet their living expenses, which can erode their portfolio quickly. If the market recovers later, these individuals have less money remaining in their portfolio to benefit from the upswing.
Many contend that the “4% rule” to be an optimal retirement strategy. This rule of thumb suggest that a retiree can withdraw 4% of their initial investment portfolio in the first year of retirement, and then adjust that amount for inflation each subsequent year, with relatively low risk of running out of money. If we were to review how the 4% rule has fared in light of sequencing risk, we can see that this is not an optimal strategy. In the below chart we see the range of outcomes when the 4% rule had been applied to portfolios since the year 1900:
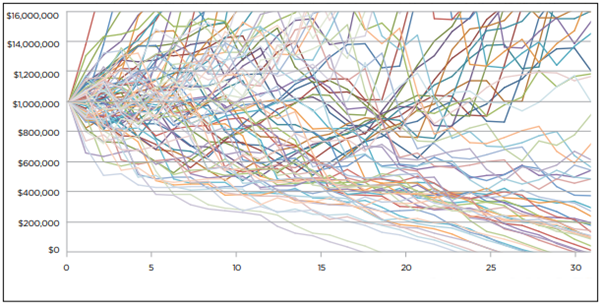
Over the last century, this may have been a reasonable strategy for many investors. However, clearly, this presents a serious problem for investors who experienced a negative return in the initial years of their retirement. For those unlucky enough to have experienced poor market performance in their retirement opening years meant they would need to have a drastic reduction in lifestyle or risk running out of money.
In my view, asset allocation is everything when it comes to retirement planning. Rather than relying on “rules of thumb” a better approach would be to focus on the right ‘mix’ of investments. Sufficient capital should be held in defensively oriented asset categories such as cash and high credit quality, short duration fixed interest securities. Ideally, there would be adequate allocation to these “defensive” asset classes to act as a volatility dampener when the proverbial hits the fan. This portfolio exposure should be able to satisfy several years’ worth of expense requirements to mitigate the need to draw down resource when markets are depressed. This won’t always be feasible for every retiree and counsel from a trusted advisor is strongly encouraged to ensure that you find the right approach for you.
Disclosure: Please note that all information provided is of a general nature and does not take into account your current financial situation, needs or objectives. Before acting on any of the information you should consider its appropriateness, having regard to your own objectives, financial situation and needs. The Prosperity Planners Pty Ltd t/a Prosperity Planners ABN 56 679 768 897 is an Authorised Representative No. 1289369 and Credit Representative No. 532716 of FYG Planners Pty Ltd Australian Financial Services Licensee and Australian Credit Licensee No. 224543 ABN 55 094 972 540 Level 2, 39-41 Alexander Street Burnie TAS 7320.